88% of Companies Use AI. About 5% Get Anything Out of It.
Adoption is nearly universal and value capture is rare, and the gap is not the model. Across McKinsey, BCG, Stanford, and MIT, the one thing that separates the companies getting returns is that they redesigned the work, not that they bought a better model. Here is what the controlled evidence actually supports, and where it runs out.

In 2025, McKinsey’s State of AI survey found 88% of organizations using AI in at least one function, up ten points in a year. In the same survey, 7% had fully scaled it. BCG’s study of 1,250-plus companies put the top tier at 5%, with 60% seeing minimal or no material value. MIT’s Project NANDA reported that 95% of enterprise gen-AI pilots returned nothing measurable to the P&L.
The numbers argue about the exact size of the winners’ circle. They agree on the shape: almost everyone has adopted AI, almost no one has captured value, and the distance between those two facts is the whole story. This is what “pilot purgatory” actually means, and it is not a technology problem.
The one finding every serious source agrees on
The binding constraint is organizational, not technical. Three independent studies, three methods, one answer.
McKinsey tested 25 organizational attributes against whether a company saw real EBIT impact from gen AI. The single biggest lever was workflow redesign, not model choice, not spend. Stanford’s Enterprise AI Playbook, built from 51 in-production deployments across 41 organizations, found that 77% of the hardest challenges were invisible costs: change management, data quality, process redesign. Technology was, in the researchers’ words, the easiest part. For 42% of those deployments, the specific model was interchangeable. The same use case ran anywhere from a few weeks to several years depending on sponsorship and existing process, and not on which model sat underneath.
BCG turned the finding into an allocation rule it calls 10-20-70: 70% of the effort goes to people and process, 20% to technology, 10% to algorithms. It is a consulting framework, so treat it as prescription rather than proof. But it is the same conclusion the other two reached from data: the model is the cheap part, and the work is the work.
Why pilots die, specifically
Pilots do not stall for mysterious reasons. MIT NANDA names the mechanism: brittle workflows, no contextual learning, a mismatch with how people actually operate day to day, and no persistent memory or feedback loop. The result is a tool that stays a personal productivity boost and never becomes a change to how the work gets done. The same report tracks the funnel that produces the 95% number: 60% of organizations evaluate a task-specific tool, 20% reach a pilot, and 5% reach production.
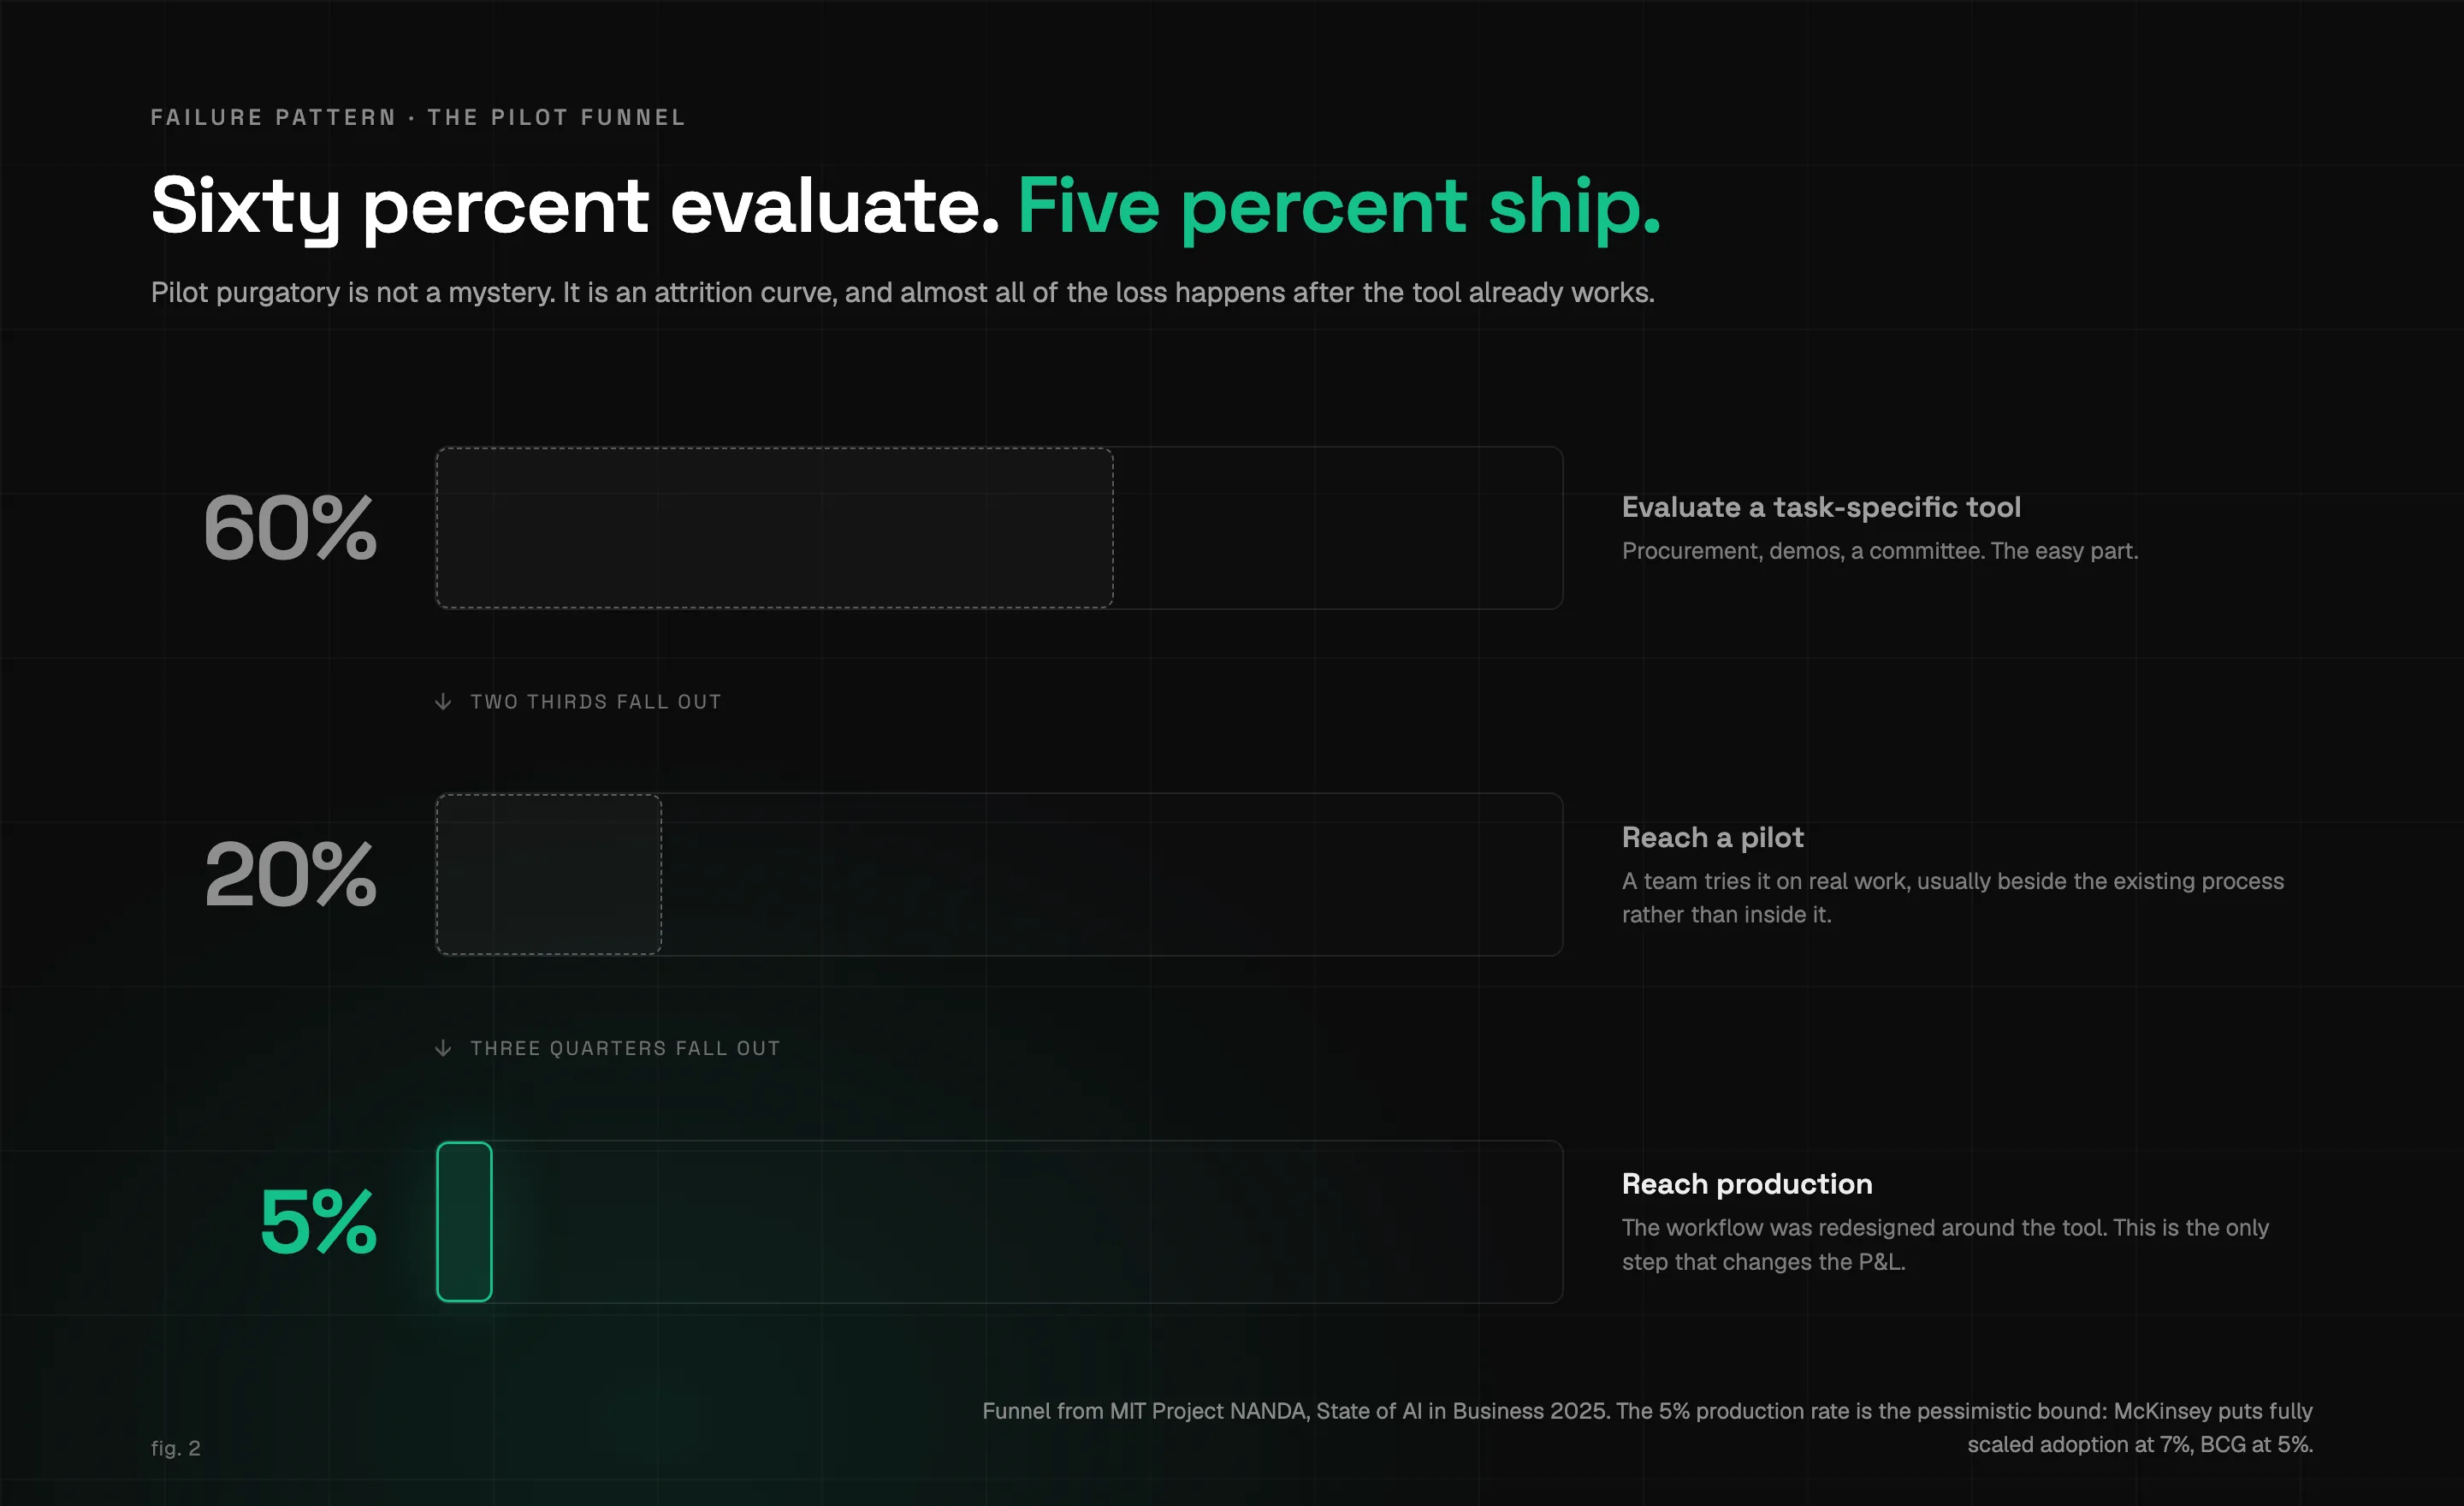
One caveat, because it matters. The 95% figure is the most-quoted and least-solid number in this entire field. It rests on a non-peer-reviewed working paper built from roughly 52 interviews and 153 survey responses, and critics have noted it codes modest-but-real gains as failures. Cite it as MIT NANDA’s finding, not as settled fact, and read it as the pessimistic bound. It points the same direction as the sturdier McKinsey and BCG numbers, just further.
The more useful finding is quieter and better sourced. Stanford reports that 61% of successful AI deployments were preceded by a failed one. The failures were not wasted. They were how teams learned to stop pointing AI at a broken workflow, stop letting a technical team own it with no business sponsor, and stop assuming the model would fix a problem that was really about redesigning the work. Most companies that win with AI lost first. That is not a consolation. It is the sequence.
What actually works, ranked by how much you can trust it
Buy before you build
Enterprises now purchase 76% of their AI use cases, up from 53% a year earlier, a near-inversion in eighteen months. MIT NANDA’s deployment data points the same way: externally partnered tools reached production roughly twice as often as internally built ones. The build-versus-buy split comes from a single report and a self-interested source (Menlo is an AI investor), so hold the exact 2x loosely. The direction is consistent across both datasets. Unless AI is your product, buying gets you to production more reliably than building.
Sequence narrow, not wide
Winning companies surface plenty of ideas, often ten or more, then concentrate adoption on a few near-term productivity gains rather than deploying everything at once. That is an observed pattern from Menlo’s data, not a proven strategy, so take it as a strong prior rather than a law. It fits everything else here: the constraint is organizational attention, and attention does not parallelize well.
Aim at the juniors first, because that is where the controlled evidence is
This is the part with real proof, and it is remarkably consistent across functions.
Customer support. The strongest single study in the field is Generative AI at Work, published in the Quarterly Journal of Economics in 2025, covering 5,179 support agents at a Fortune 500 company. A gen-AI assistant raised issues resolved per hour by 14% on average, 34% for novices, and close to nothing for the most experienced agents. The mechanism: the AI spread the tacit know-how of the best workers to everyone else.
Software engineering. A pre-registered randomized trial across Microsoft, Accenture, and a Fortune 100 firm, pooling 4,867 developers, found a 26% increase in completed tasks for developers given an AI coding assistant, with larger gains for the less experienced. The widely-cited 55.8% speed figure from the Copilot experiment is real but comes from one narrow lab task, so the 26% enterprise number is the one to trust. A separate Microsoft field study put the task-time reduction around 31%.
Knowledge and creative work. The BCG and Harvard “jagged frontier” experiment, 758 consultants, found AI users completed 12% more tasks, 25% faster, at meaningfully higher quality, on work inside AI’s capabilities. On a task designed to sit just outside those capabilities, AI users were 19 points less likely to get it right. That second number is the one most write-ups drop, and it is the one worth keeping: AI raises the floor on work it can do and quietly lowers accuracy on work it can’t, and confident users cannot always tell which is which.
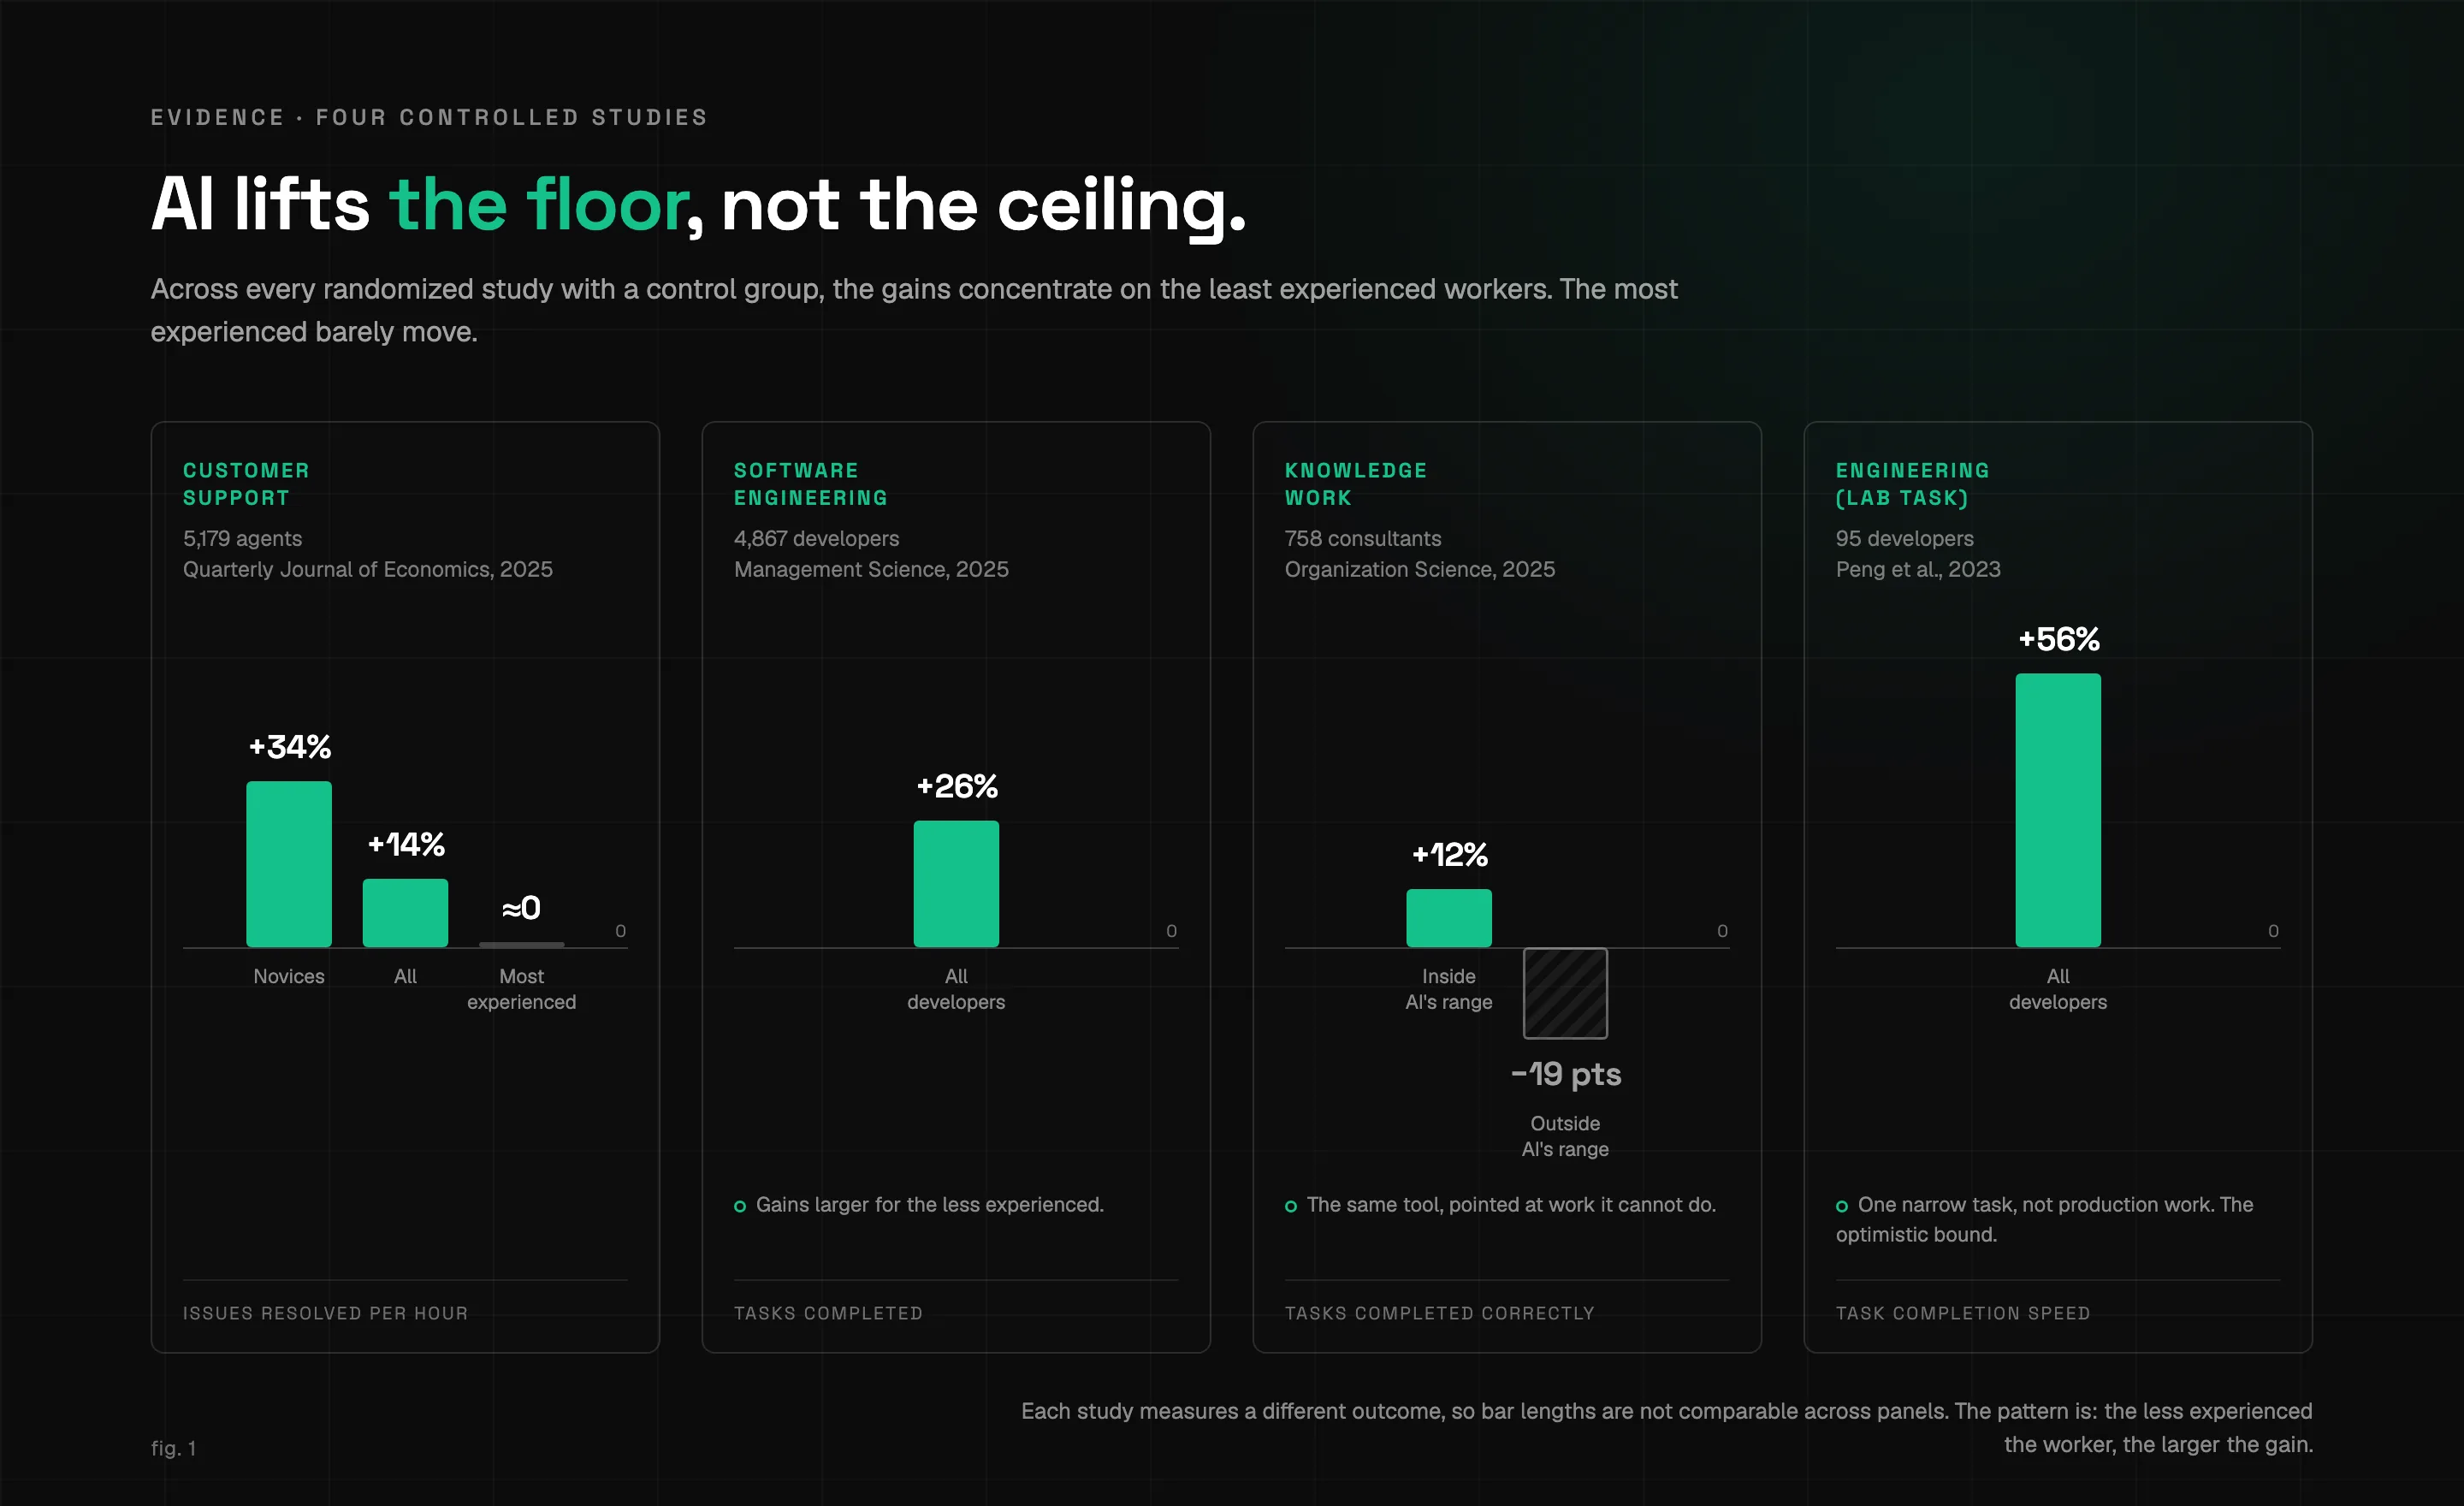
The pattern that survives all four studies: AI compresses the gap between novice and expert. The largest, most reliable returns come from getting a competent-median performance out of people who were below it. That is the thesis to build a rollout on.
The contradiction worth stating out loud
The ROI numbers genuinely disagree, and the disagreement is instructive. Deloitte’s 2025 survey reports 84% of companies investing in AI say they are gaining ROI. MIT says 95% see no return. Both are real, verified figures.
They do not actually conflict. They measure different things. Deloitte’s number is soft and self-reported (“are you gaining ROI?”), and Deloitte’s own data shows payback usually takes two to four years, with only 6 to 13% seeing it inside twelve months. MIT measures sustained P&L value at scale. One is asking people how they feel about the trajectory; the other is checking the books. When you see a triumphant AI-ROI stat, the first question is which of those two it is measuring. Most of the optimistic ones are the first.
Where the evidence runs out
A straight read means saying where the ground gets soft, not just where it holds.
Sales and back-office operations have almost no controlled evidence. The vendor numbers are loud (“AI SDRs boost conversions 70%,” “60% faster procurement cycles”), self-reported, and uncontrolled. There is no sales-specific randomized trial worth citing, and Gartner projects that by 2028 fewer than 40% of sellers will say AI agents improved their productivity. For operations, the famous cases (JPMorgan’s contract-review tool eliminating 360,000 lawyer-hours) are self-reported and often years old. Use these as illustrations, never as measured proof.
The org-structure playbooks are consulting theory, not measured science. “Stand up an AI Center of Excellence,” “move from centralized to hub-and-spoke at 15 to 20 initiatives,” “budget 3 to 5% of revenue at maturity.” None of it has a controlled study behind it. There is exactly one real number in the category: IBM’s Institute for Business Value, surveying 600-plus Chief AI Officers in 2025, found those running centralized or hub-and-spoke models reported up to 36% higher ROI than peers in decentralized structures. Even that is a self-reported survey correlation, not a controlled result, and mature, well-run companies tend to both centralize and get better returns. Cite it as a correlation. The transition thresholds and maturity timelines that fill most adoption blogs are round numbers invented for the slide.
Where to start
The evidence points to a specific order, and it is not the order most companies use.
Pick the work, not the tool. Choose one workflow where a below-median performer costs you real money: support resolution, onboarding, first-draft anything. That is where the controlled gains are largest and easiest to measure.
Buy the tool and put a business owner on it. Not the technical team alone. The 61%-failed-first data is mostly a record of technical teams owning things no one in the business was accountable for.
Redesign the workflow around the tool, then measure one number. Resolutions per hour, tasks completed, cycle time. Baseline it before you start. This is the 70% of the work that BCG’s rule is pointing at, and the step most pilots skip on the way to purgatory.
Expect the first attempt to underperform, and keep the learning. Budget for a second version. The companies that scaled almost all failed a version first, and treated the failure as tuition rather than a verdict on AI.
Adoption was never the hard part. 88% of companies cleared that bar. The 5% did one more thing: they changed the work to fit the tool, instead of buying the tool and hoping the work would change on its own.